import PlotCard from "@/components/ui/plot-card";

const points: [number, number][] = [
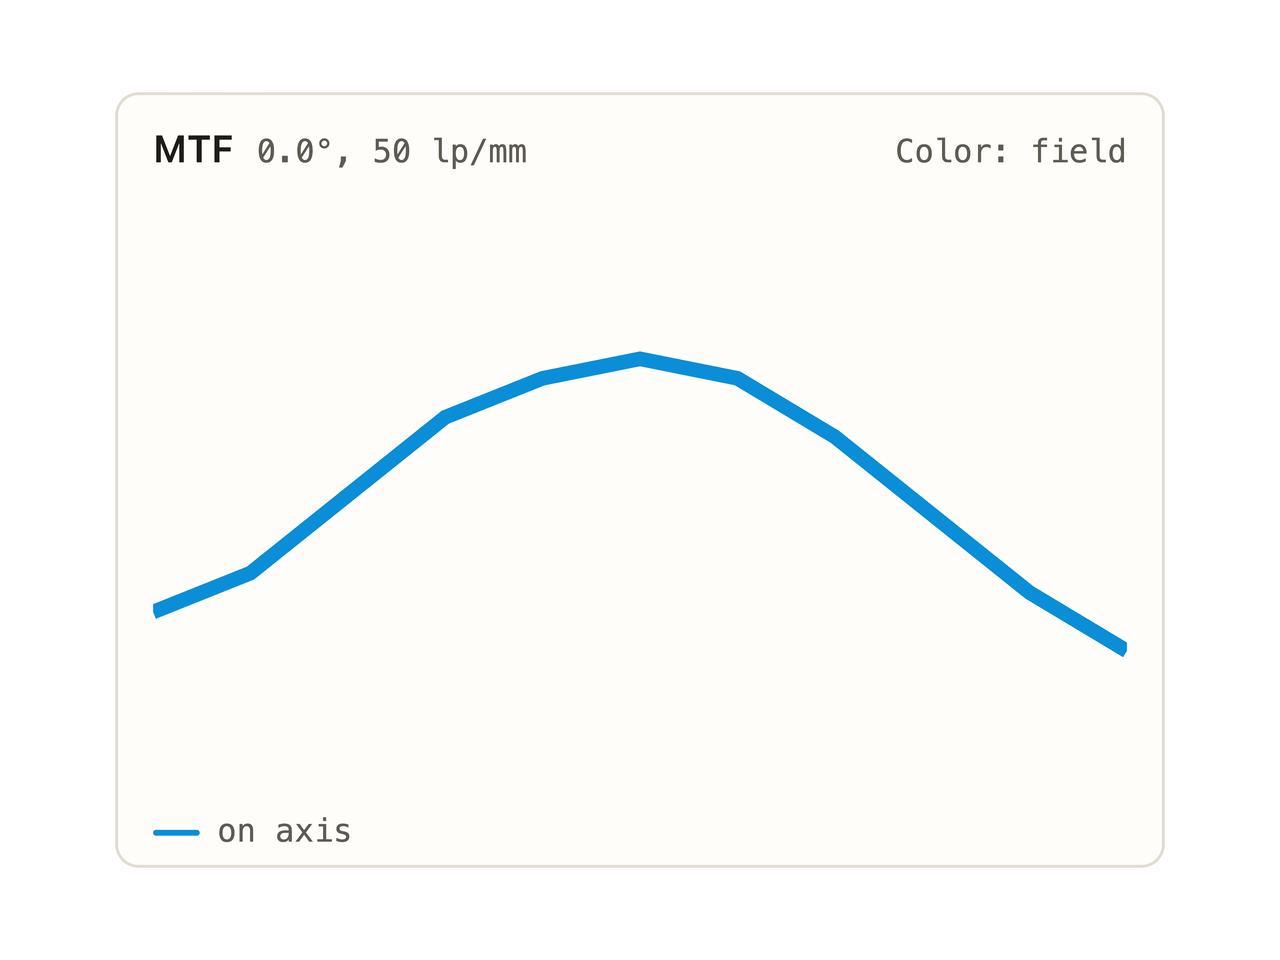
  [0, 42],
  [10, 38],
  [20, 30],
  [30, 22],
  [40, 18],
  [50, 16],
  [60, 18],
  [70, 24],
  [80, 32],
  [90, 40],
  [100, 46],
];

function samplePath() {
  return points.map(([x, y], i) => `${i === 0 ? "M" : "L"}${x},${y}`).join(" ");
}

export default function PlotCardDemo() {
  return (
    <div className="eleo" style={{ width: 360 }}>
      <PlotCard title="MTF" meta="0.0°, 50 lp/mm" colorKey="Color: field">
        <svg
          viewBox="0 0 100 60"
          width="100%"
          height="160"
          style={{ display: "block" }}
        >
          <path
            d={samplePath()}
            fill="none"
            stroke="var(--field-1)"
            strokeWidth={1.5}
          />
        </svg>
        <div className="eleo-legend" style={{ marginTop: 8 }}>
          <span
            className="eleo-key"
            style={{ "--c": "var(--field-1)" } as React.CSSProperties}
          >
            on axis
          </span>
        </div>
      </PlotCard>
    </div>
  );
}