"use client";

import * as React from "react";
import {
  ChartContainer,
  ChartLegend,
  ChartLegendContent,
  ChartTooltip,
  ChartTooltipContent,
  type ChartConfig,
} from "@/components/ui/chart";
import {
  Card,
  CardContent,
  CardDescription,
  CardHeader,
  CardTitle,
} from "@/components/ui/chart-utils/card";
import * as Recharts from "recharts";

const visitors = [
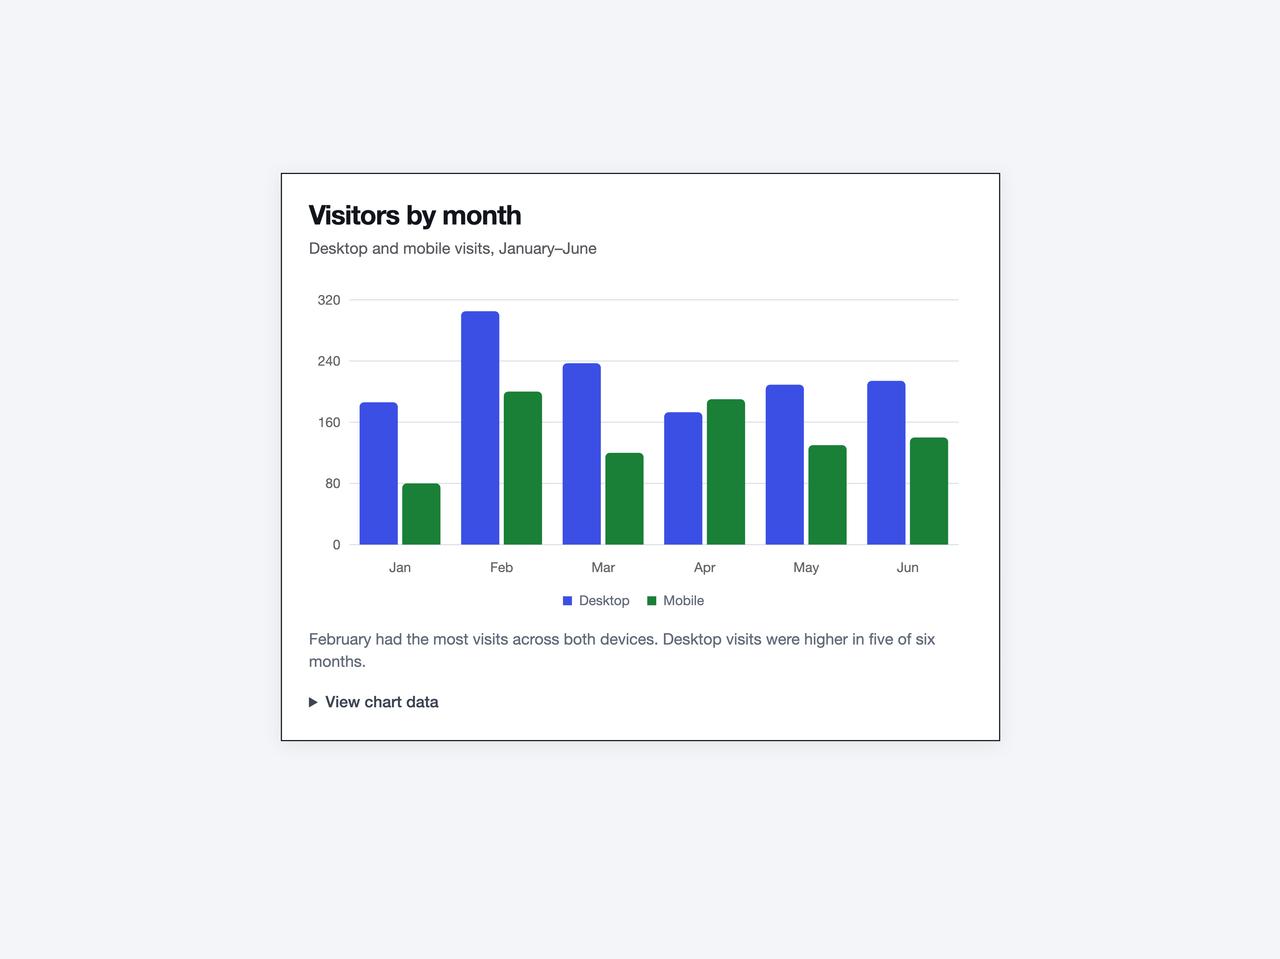
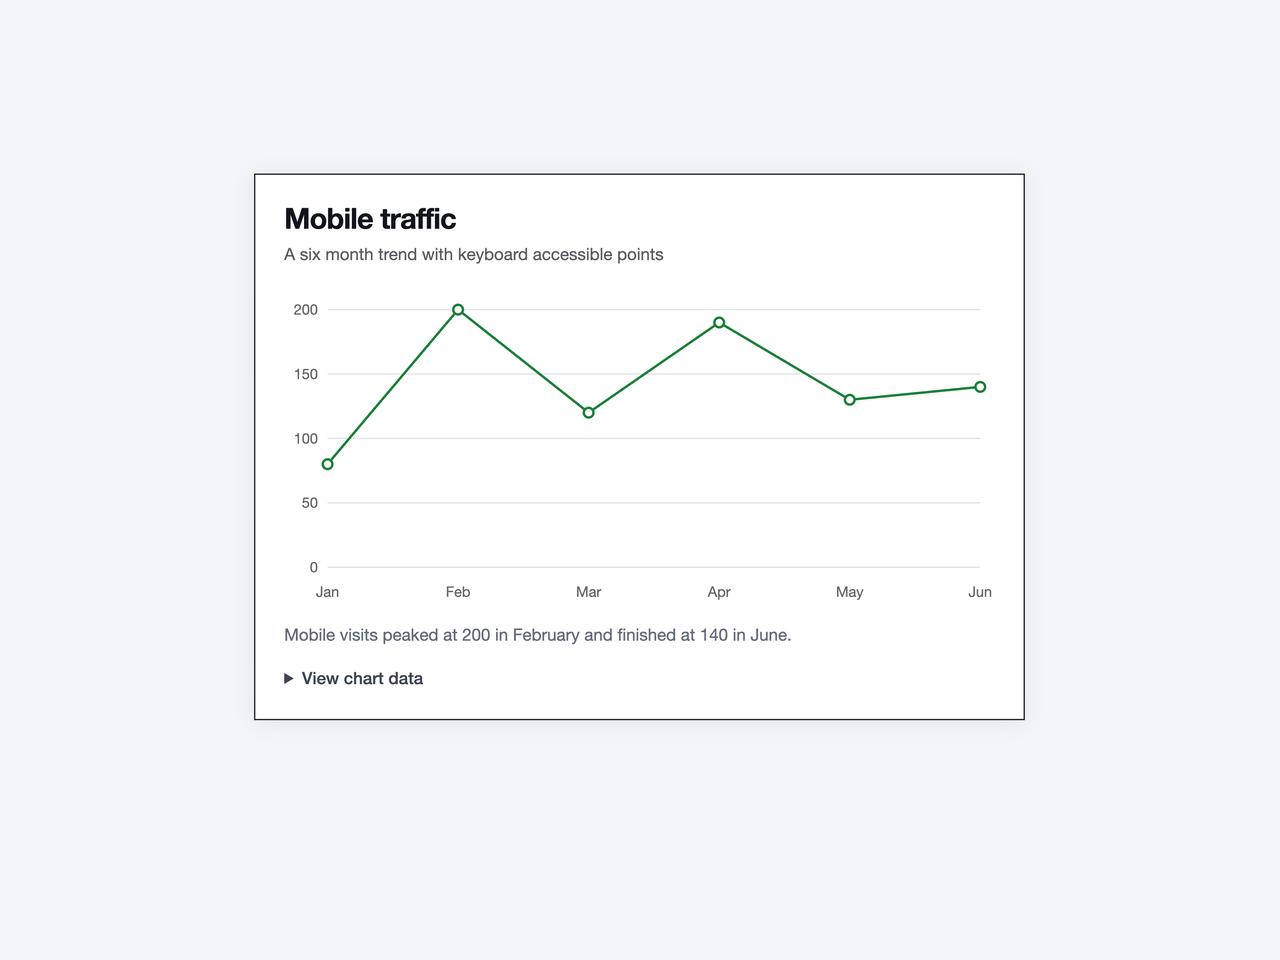
  { month: "Jan", desktop: 186, mobile: 80 },
  { month: "Feb", desktop: 305, mobile: 200 },
  { month: "Mar", desktop: 237, mobile: 120 },
  { month: "Apr", desktop: 173, mobile: 190 },
  { month: "May", desktop: 209, mobile: 130 },
  { month: "Jun", desktop: 214, mobile: 140 },
];

const visitorConfig = {
  desktop: { label: "Desktop", color: "var(--color-accent)" },
  mobile: { label: "Mobile", color: "var(--color-ok)" },
} satisfies ChartConfig;

function ChartData() {
  return (
    <details className="mt-4 font-sans text-sm text-text-2">
      <summary className="cursor-pointer rounded-sm font-medium focus-visible:outline-2 focus-visible:outline-accent">
        View chart data
      </summary>
      <div className="mt-3 overflow-auto">
        <table className="w-full text-start tabular-nums">
          <caption className="sr-only">Visitors by month and device</caption>
          <thead>
            <tr>
              <th scope="col" className="py-2 text-start">
                Month
              </th>
              <th scope="col" className="text-end">
                Desktop
              </th>
              <th scope="col" className="text-end">
                Mobile
              </th>
            </tr>
          </thead>
          <tbody>
            {visitors.map((row) => (
              <tr key={row.month} className="border-t border-hairline">
                <th scope="row" className="py-2 text-start font-normal">
                  {row.month}
                </th>
                <td className="text-end">{row.desktop}</td>
                <td className="text-end">{row.mobile}</td>
              </tr>
            ))}
          </tbody>
        </table>
      </div>
    </details>
  );
}

export default function ChartDemo() {
  return (
    <Card className="w-[min(640px,calc(100vw-48px))]">
      <CardHeader>
        <CardTitle>Visitors by month</CardTitle>
        <CardDescription>
          Desktop and mobile visits, January–June
        </CardDescription>
      </CardHeader>
      <CardContent>
        <figure>
          <ChartContainer
            config={visitorConfig}
            className="h-72"
            role="group"
            aria-label="Monthly visitors by device"
          >
            <Recharts.BarChart
              accessibilityLayer
              data={visitors}
              margin={{ top: 12, right: 12 }}
            >
              <Recharts.CartesianGrid vertical={false} />
              <Recharts.XAxis
                dataKey="month"
                axisLine={false}
                tickLine={false}
                tickMargin={10}
              />
              <Recharts.YAxis axisLine={false} tickLine={false} width={36} />
              <ChartTooltip cursor={false} content={<ChartTooltipContent />} />
              <ChartLegend content={<ChartLegendContent />} />
              <Recharts.Bar
                dataKey="desktop"
                fill="var(--color-desktop)"
                radius={[4, 4, 0, 0]}
                isAnimationActive={false}
              />
              <Recharts.Bar
                dataKey="mobile"
                fill="var(--color-mobile)"
                radius={[4, 4, 0, 0]}
                isAnimationActive={false}
              />
            </Recharts.BarChart>
          </ChartContainer>
          <figcaption className="mt-4 font-sans text-sm text-text-3">
            February had the most visits across both devices. Desktop visits
            were higher in five of six months.
          </figcaption>
          <ChartData />
        </figure>
      </CardContent>
    </Card>
  );
}