import DonutChart from "@/components/ui/donut-chart";

const money = (value: number) =>
  `$${Math.round(value).toLocaleString("en-US")}`;

export default function DonutChartDemo() {
  return (
    <div className="flex w-full flex-wrap items-center justify-center gap-8 p-8">
      <div className="flex flex-col items-center gap-3 rounded-[20px] border border-line bg-surface p-6 shadow-[var(--shadow-card)]">
        <DonutChart
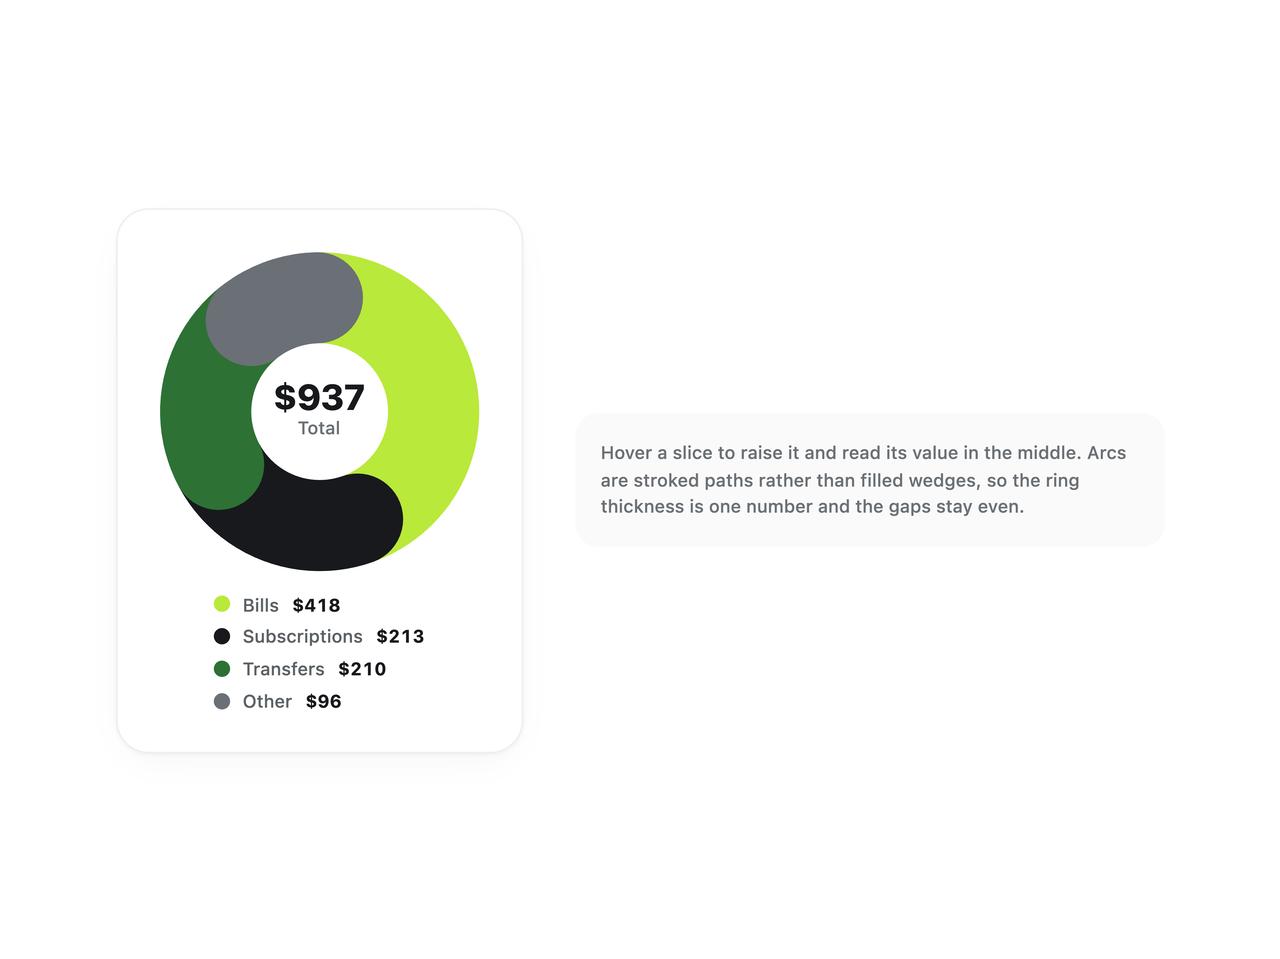
          label="Spending by category"
          format={money}
          slices={[
            { id: "bills", label: "Bills", value: 418 },
            { id: "subs", label: "Subscriptions", value: 213 },
            { id: "transfers", label: "Transfers", value: 210 },
            { id: "other", label: "Other", value: 96 },
          ]}
        >
          <p className="text-[22px] font-extrabold leading-none text-ink">
            $937
          </p>
          <p className="text-[11px] font-medium text-ink-faint">Total</p>
        </DonutChart>
      </div>
      <div className="max-w-[36ch] rounded-[14px] bg-surface-sunken p-4">
        <p className="text-[11px] font-medium leading-normal text-ink-faint">
          Hover a slice to raise it and read its value in the middle. Arcs are
          stroked paths rather than filled wedges, so the ring thickness is one
          number and the gaps stay even.
        </p>
      </div>
    </div>
  );
}